
TL;DR
I’ve never known the manufacturer of an Internal Combustion Engine (ICE) car to cite how fast gas can be poured into its tank as an advertising point. Yet charging speed is used as an advertising point with essentially any EV. What does it mean, really, when you say a Cadillac Lyriq can be charged at 190 kW? Is charging speed really an important differentiator for EVs?
Yes, but it probably isn’t the most important metric. Why? Because charging speed occurs on a curve. Read on for details.
The Nitty Gritty Details of Charging Curves
Let’s begin this discussion about how charging is a curve by explaining the terms ‘power’ and ‘energy’. While they are related, they are not the same thing. ‘Power’ is commonly expressed in Watts (or kilo-Watts abbreviated as kW). ‘Energy’ is commonly expressed in Watt-hours (or kilo-Watt hours abbreviated as kWh). Watt is also the surname of James Watt, whose name defines the measurement of power according to the International System of Units, so the term is capitalized.
From the perspective of classical physics, energy is a measure of the amount of work being performed, and power is the rate at which that work is being delivered. Think of the relationship of energy and power in a similar way as you would for gallons and flow rate of water. A swimming pool needs x gallons to fill it completely. To fill your swimming pool, you could use a garden hose, a fire hose, or even a helicopter with a water bucket. The end result is the same amount of water in the pool, but the flow rate (and, therefore, the time it takes to fill) is different.
In the above example, gallons (an amount of water) are analogous to kWh (the amount of energy), and flow rate is analogous to kW (the flow rate of energy). Bringing this back to the topic of EVs, the pool is analogous to the battery as it is designed to hold an amount of energy. You can fill it (charge it) with a Level 2 EVSE (the garden hose) or with a DCFC (the fire hose). I guess the helicopter with the fire bucket would be a battery swap, but that is a different topic entirely.
When you drive an ICE car, you don’t care how many gallons per second it takes to fill up the tank—you just want x number of gallons in your tank. And frankly, you probably didn’t even care about that. You wanted miles, but because you knew roughly how many miles you got per gallon, you knew how many gallons to buy.
Nothing has really changed, and at the same time, everything has changed. With an EV, the fill rate in terms of miles of energy added per minute is so much slower than an ICE car that, well, we all kinda want to know how long it is going to take to add those miles. And that brings me squarely to the topic of charge curves.
That’s because when I say a Cadillac Lyriq charges at 190 kW, that number doesn’t even begin to tell me everything I need to know. Frankly, without an asterisk attached to the 190 kW charge rate, the number is little more than a bullet point in an advertisement.
In this column, we’ll talk about one of those asterisks—the charge curve. This just means that the advertised rate is merely a peak rate when everything is optimum. No battery can sustain its peak charging rate until full. Most EV batteries can sustain the peak charge rate for only a few minutes before it tapers off. Other asterisks attached to the peak charge rate are battery temperature and the capability of the charger (or EVSE) being used.
One last item of business first. Recall that whenever you plug into a DCFC (or an EVSE), the car controls the maximum power being delivered, up to the maximum capability of the equipment it is using.
The Charge Curve
A battery is an electrochemical device, and its maximum charge rate is ultimately limited by the chemical reaction time that is being used to convert electrical energy to and from chemical energy. It’s as simple as that. Some atoms on the periodic table can react very fast; those items are often used in bombs and such. One of the great properties of lithium is that it sits at the Goldilocks of chemical reaction times—not too slow and not too fast.
There are, of course, other factors that limit charge speed, including the power of electronics on the car, but arguably the biggest factor limiting charge speed is temperature. Some EVs have better thermal management than others and can charge faster. If you try to apply more power during the charge cycle than the battery can accommodate, you’ll experience what an engineer might quaintly refer to as a thermal runaway, or what any fireman would call a fire. If you try to extract more power during the discharge cycle than the battery can accommodate, voltage will sag (drop), and the electrical circuit can simply “brownout.” Brownouts can happen to power grids, too.
To preclude either scenario, EV manufacturers use a Battery Management System (BMS) to limit the charge and discharge rates. During the charge cycle, the BMS will primarily monitor things and then calculate the maximum allowable charge rate. Arguably the two most important items monitored by the BMS would be battery temperature and the current state of charge (is the battery completely dead at 0% or fully charged at 100%, or somewhere in between?).
The EV manufacturer, along with the manufacturer of the battery cells, will design the BMS to allow the maximum possible charge rate for a given set of circumstances. The BMS is why the same battery at the same state of charge will charge at a different rate at 120°F than at 80°F or 0°F.
Assuming the DCFC (or EVSE) is operating as designed, and the car isn’t exceeding its capability, it is the BMS that gives us the charge curve as it monitors the battery temperature and the battery SOC.
Consider the charge curve for a 2023 Cadillac Lyriq. You can watch this entire charging session (at 10x real-time) on Tom’s State of Charge YouTube channel. The peak rate observed is 183 kW, which compares favorably to the advertised rate of 190 kW. But as you can see, the charge rate drops significantly above about 20% SOC, and that’s going to limit how usable the Lyriq will be on a road trip.
This is data from one charging session in July 2023, and charging the Caddy on a cooler day might yield more favorable results. Charging the same car on a cold day will yield less favorable results.
So what does this mean? Cadillac does, in fact, (closely) meet its advertised peak charge rate. However, when you take in the entirety of the charging session, the Caddy gets a C at best – at least for this particular session.
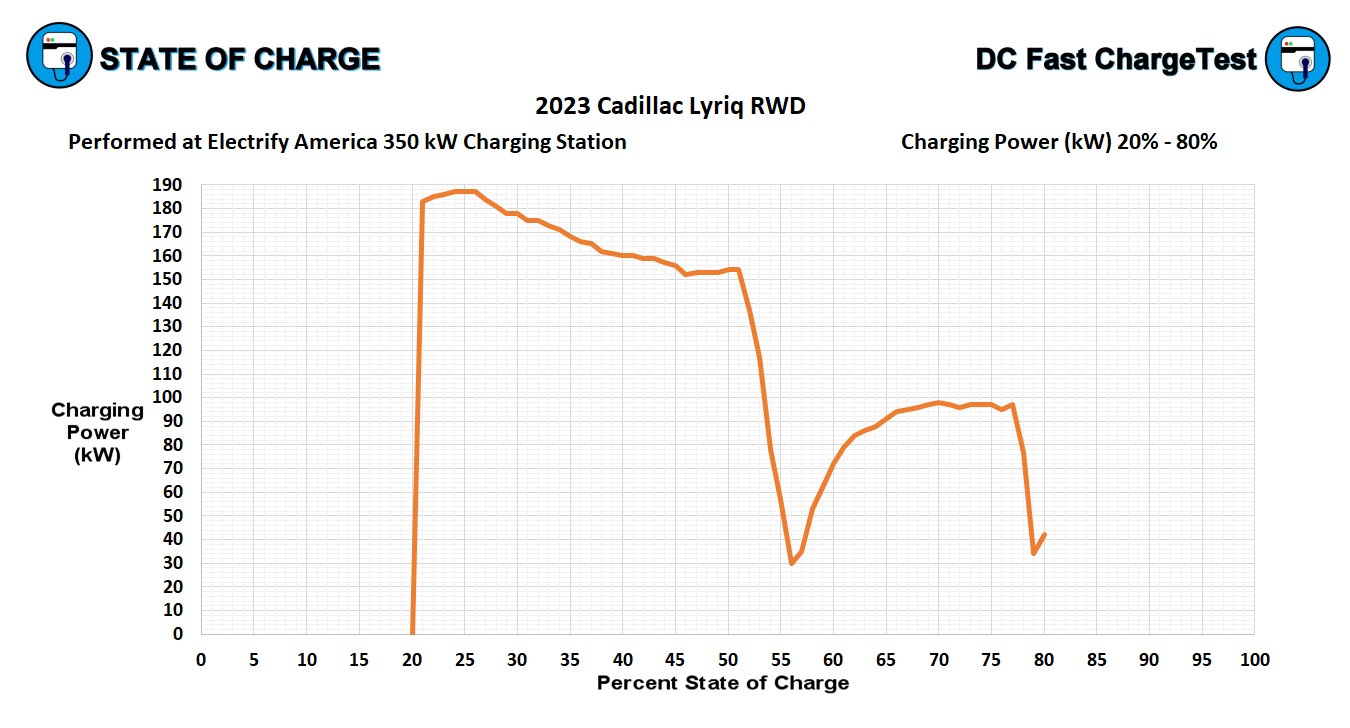
Cadillac’s first big splash into the EV world disappoints a bit regarding charging. While it does match its peak advertised rate, most of the charging occurs below 100 kW, which means using this car on a road trip could be frustrating. Image credit: Tom Moloughney and State of Charge.
Next week we will dive into how the charge curve and an EV’s efficiency work together to form what I like to call drivability.


0 Comments